Monthly Newsletter - March 2025 |
Discover the latest platform updates, including powerful new tools like Data Query, Floating Storage Report, Mobile Voyage Calculator upgrades, and Sanctioned Vessel tracking—plus key highlights on Dry and Tanker market dynamics. |
|
|
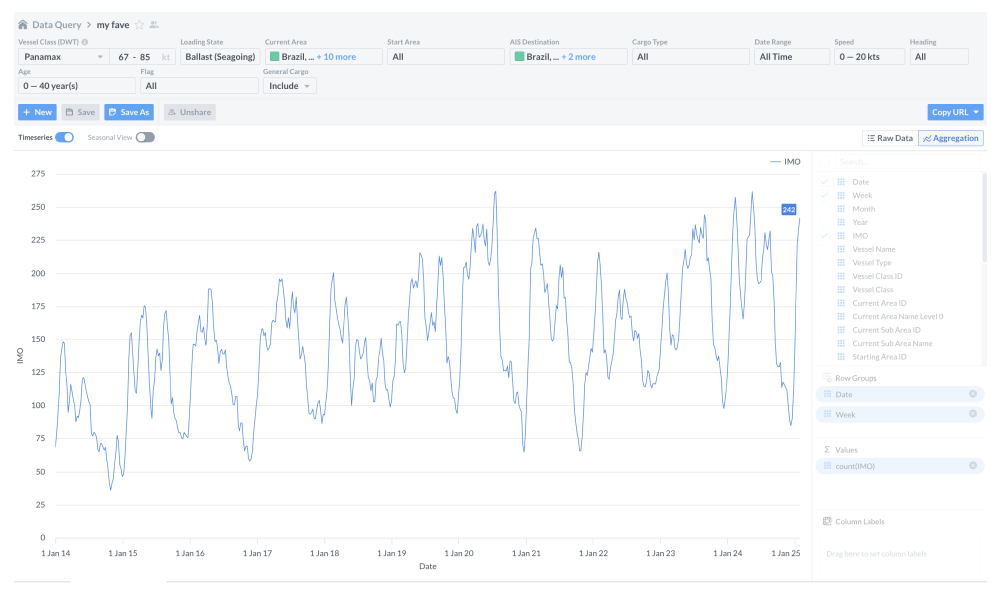
With the new Data Query feature, you can pull historical market data going back to 2014—and keep it refreshable with dynamic URL links (can be used in Excel, Google Sheet, Python, etc.). Whether you need raw numbers or pivoted datasets, it’s all customisable to your workflow. The built-in dashboard gives you one-click access to all your saved queries and filters, making it easier than ever to automate analytics and power long-term strategic decisions. |
| Monitor global floating storage activity and its impact on crude oil supply with our newly launched report in the Commodities module. Analyse trends to spot opportunities or risks, explore historical benchmarks, and customise your view with filters tailored to key value drivers. Adjust saved views dynamically by parameters such as minimum stationary days, area, and cargo grade, and explore active storage locations on an interactive map. An expanded version covering all commodities is coming soon! |
|
|
Improved Mobile Voyage Calculator |
With our latest update, you can now edit even more voyage inputs right from your iOS app. Dry users can adjust Terms, L/D Rates, Turn Time, and more—while Tanker users can fine-tune Turn Time and Duration. Update the app and make quick, accurate decisions on the go. |
| Sanctioned Vessel Visibility |
You can now identify sanctioned vessels directly within Signal Ocean voyage data—including the organisation behind each sanction (e.g., OFAC, EU). No more toggling between systems or relying on separate data sources. Whether you’re trading, chartering, or analysing fleet movements, having sanctions visibility embedded in voyage records helps you reduce risk and act faster. |
|
|
Capesize Brazil-to-North China rates |
Capesize rates on the Brazil-to-North China route are showing signs of life — this rebound seems more about fewer ballasters than booming demand. Meanwhile, iron ore volumes into China remain soft, and February closed 6% below last year’s levels. |
| |
|
Evolution of VLCC net supply growth in the Arabian Gulf |
VLCC net supply trends in the AG and what they signal for the Baltic (TD3) rates. After a brief supply spike softened rates, a downward correction is now underway — but will it last? With gross supply still outpacing demand over the next 30 days, market sentiment remains cautious. |
| |
|
Decrease in ballasters on the C3 route |
China is ramping up iron ore imports despite soft steel demand, and Brazilian exports are surging. Add to that growing congestion in the South Atlantic and fewer Capesize arrivals, and the supply-demand gap is widening — giving freight rates a solid boost. |
| |
|
AG-to-Europe crude flows decline |
Europe pulling back and the Far East/India holding steady. March volumes to Europe have dipped significantly vs. 2024, possibly due to policy shifts or alternative sourcing. Meanwhile, the Far East is boosting imports to stay ahead of potential supply risks, as oil price volatility and geopolitical tensions keep the market on edge. |
| |
|
Canadian crude re-routes shake up tanker rates |
U.S. tariffs on Canadian crude have triggered a sharp pivot in trade flows, with exports now surging toward Europe—hitting nearly 8 million barrels in March alone. This shift is boosting Aframax demand and driving a spike in Mediterranean freight rates, with TD19 rates climbing rapidly. |
| |
|
Thank you for catching up with the latest from Signal! Stay tuned for more updates, insights, and tools. Click here to download this newsletter. |
|
|
© 2025 The Signal Group. All Rights Reserved. |